Visualizer

Visualizer

Responsive charts and tables for WordPress, updated effortlessly.

#2 dans WordPress Table Plugin
2 min read · Updated 10/5/2025
Visualizer homepage screenshot

At a glance

Quick overview for Visualizer: rating, pricing summary, key features, and highlights.

Ciroapp review

4.6
Dynamic WordPress visualization with powerful sync.

We found Visualizer to be a robust tool for managing complex data within WordPress, offering crucial features like automatic synchronization and advanced external database importing. The pricing is transparently structured across three tiers, and the widespread external praise for customer support suggests a reliable partner. Overall, Visualizer is a top-tier solution for any site needing dynamic, professional data visualization capability.

Pros

  • Pro:Supports dynamic data synchronization from external APIs and databases.
  • Pro:Data is easily edited right on the page using an Excel-like editor.
  • Pro:Robust custom permissions allow secure team collaboration.
  • Pro:Charts are translation ready via WPML support for global audiences.

Cons

  • Con:No explicit free trial is provided for the paid professional tiers.
  • Con:Renewal prices are significantly higher than the introductory rate.
  • Con:Some users have reported confusion or issues regarding site licensing limits.
Money-back guarantee
Yes — 30 days
Range: $99–$399/yearYearly subscription
This section is a summary. Detailed sections about features, use cases, pricing, and reviews follow below.

Visualizer review, pricing, features, pros & cons

Trying to display complex data on your WordPress site can be frustrating. Manually updating charts or making them look great often wastes time. Visualizer solves this by letting you create responsive, fully-customizable tables and charts quickly.

You can easily edit data right on your posts using its intuitive, Excel-like editor. 💡

What is Visualizer?

Visualizer is a powerful WordPress manager for tables and charts, trusted by over 40,000 happy users. It gives you 15 chart types to present data in a highly engaging way. The charts are innovative and specifically built for the modern web.

Whether you need a simple Pie Chart, a detailed Line Chart, or an interactive DataTables table, Visualizer makes the data attractive and easy to understand. It’s built for anyone who needs to clearly communicate complex information on their website. ✅

Visualizer Key Features

💡 Unrivaled Data Synchronization

Visualizer helps you stop stressing over manual data entry. You can set up schedules to synchronize your charts seamlessly. This ensures your information stays fresh and highly functional without constant manual intervention.

Automatic synchronization works with various sources, including external APIs, databases, and online files like Google Sheets or CSVs. You can schedule updates to refresh every hour or day, making long-term chart maintenance simple.

This feature also allows you to import data based on your WordPress installation itself. You can easily create charts that display your current number of posts, pages, or attachments for internal tracking or public view.

✨ Versatile Data Source Support

Visualizer offers flexibility by supporting many ways to import your complex data. You aren't limited to simple uploads or basic file types. This system is perfect if you rely on consistent external data flows.

You can pull data using database queries or import directly from external APIs and remote URLs that contain JSON or CSV files. The platform also features specialized importers for WooCommerce Reports and can reuse data from charts you created previously. If needed, you can always enter the data manually using the Excel-like editor.

✨ Intuitive Editing Workflow

Managing your data is fast and efficient thanks to the user-friendly editing tools. Visualizer includes an intuitive, Excel-like editor for quick data entry and modification.

To maximize your productivity, use the On-page Data Editor. This powerful tool lets you edit your chart or table data right on the post itself while you are viewing it. You save valuable time because you see the result immediately without switching back to the backend dashboard.

✨ Extensive Chart Variety and Customization

Choose the perfect visualization to communicate complex information clearly. Visualizer provides 15 customizable chart types, ensuring you have the right tool for any dataset.

These innovative charts leverage robust options from both Google Charts and Charts.js. Every chart, whether it is a detailed Line Chart or a simple Gauge Chart, is fully responsive and adjusts to any screen size. Each type features dedicated customization options so you control the appearance, colors, and behaviors.

✨ Enhanced Security and Collaboration Controls

When working in a team or handling sensitive numbers, security is paramount. Visualizer features an extensive custom permissions system to protect your content. You can select exactly who is allowed to view or edit the charts.

This system gives you granular control over publishing environments. You can customize permissions to allow specific editors to modify charts. There is even an option available if you want to allow visitors to adjust certain data directly on the page.

✅ Interactive Display and Front-End Filtering

Give your website visitors a dynamic experience with highly interactive displays. Interactive charts offer customizable designs and behaviors, improving data communication and accessibility for your users.

For HTML tables, you can instantly add advanced controls. These include pagination, multi-column ordering, and instant text search capabilities. Furthermore, you can enable a Data Filter feature that allows front-end visitors to actively exclude specific data points from the graph display.

Use Cases

🔄 Automating Monthly Reporting from Google Sheets

Many businesses manage recurring data, like sales figures or visitor statistics, stored in external spreadsheets. Manually copying this data into WordPress every month quickly becomes tedious and risks errors. Visualizer eliminates this repetitive manual work completely. You simply connect your chart to the sheet’s public URL or an external API source.

Then, you set up the Periodic Data Synchronization feature. This schedules the chart to automatically refresh the data source every day, hour, or whenever you choose. Your publicly displayed reports remain current without any further effort from your team. This capability saves serious administrative time.

🔍 Creating Interactive Data Directories for Visitors

If you need to share large datasets—such as product catalogs, resource lists, or directories—a standard, static HTML table is ineffective. Visualizer offers the powerful DataTables chart type for this exact purpose. This transformational feature adds essential interaction controls immediately.

Visitors gain the ability to sort by multiple columns, use instant search functions, and paginate through entries. You can also allow front-end filters so users can exclude specific data visually. This creates a much more dynamic and accessible experience for your entire audience.

✍️ Rapid Testing and Editing of Live Content

Imagine you spot a typo or want to quickly adjust a data point shown in a chart on a live post. Traditionally, you would leave the page, navigate the backend, find the chart, edit the static data, and then return to the post. This process wastes valuable time.

Visualizer’s On-page Data Editor lets certain users modify the chart data right where it lives, inside the published post. You use an intuitive, Excel-like interface to make the changes and see the results instantly before saving. This workflow is incredibly helpful for immediate fixes or final content refinement.

🔒 Securing Sensitive Internal Metrics

Problem: You need to display a sales tracking chart, but only authenticated managers should be able to view and edit the sensitive data.

Approach: Use the Custom Permissions for Charts system. You restrict viewing permission to specific user roles, like 'Editor' or 'Administrator.' You can also individually ensure that only the correct editors have the ability to modify the chart data.

Outcome: The sales data chart can be embedded safely on an internal page, remaining completely hidden from general visitors and ensuring only authorized team members can make adjustments.

📈 Displaying Comprehensive Website Growth Visually

You often need to track and visualize the internal health metrics of your WordPress site. Visualizer supports importing data directly about your WordPress installation itself. You can easily connect to this source and pull in metrics like the number of posts, pages, or published attachments.

Use a dynamic chart—like a Column or Gauge chart—to display these metrics clearly. This is perfect for sharing site growth milestones with stakeholders or transparently showing users how extensive your resource library is.

🌐 Ensuring Global Accessibility Through Translation

For websites serving a global audience, data visualization must cross language barriers effectively. Visualizer integrates fully with the WPML plugin. This integration means that the surrounding numerical charts and tables can be translated along with the rest of your site content.

Your data graphs communicate clearly in every language you support. This ensures that crucial information is understood correctly by your entire international readership.

Pricing Overview for Visualizer

Pricing range
$99–$399/year
Pricing types
Yearly subscription
Money-back guarantee
Yes — 30 days

Visualizer Pro is sold via three annual plans designed for different needs, starting at $99 per year for individual users. All plans include 15 chart types and data import options.

Plans & Pricing

Personal

Yearly$99
1 site supported
  • Support & Updates for 1 site
  • Email Support
  • 15 chart types
  • Data Import Options (CSV, API, WooCommerce endpoints)
  • Chart Translation (WPML support)

Plus

Yearly$199
3 sites supported
  • Support & Updates for 3 sites
  • Priority Email Support
  • 15 chart types
  • Import data from any external database
  • Chart Translation
  • Custom Permissions for Charts
  • On-page Data Editor
  • Periodic Data Synchronization (all types)

Infinite

Yearly$399
Unlimited sites supported
  • Support & Updates for unlimited sites
  • Live Chat & Priority Support
  • 15 chart types
  • Import data from any external database
  • Chart Translation
  • Custom Permissions for Charts
  • On-page Data Editor
  • Periodic Data Synchronization (all types)
  • + 1 more features

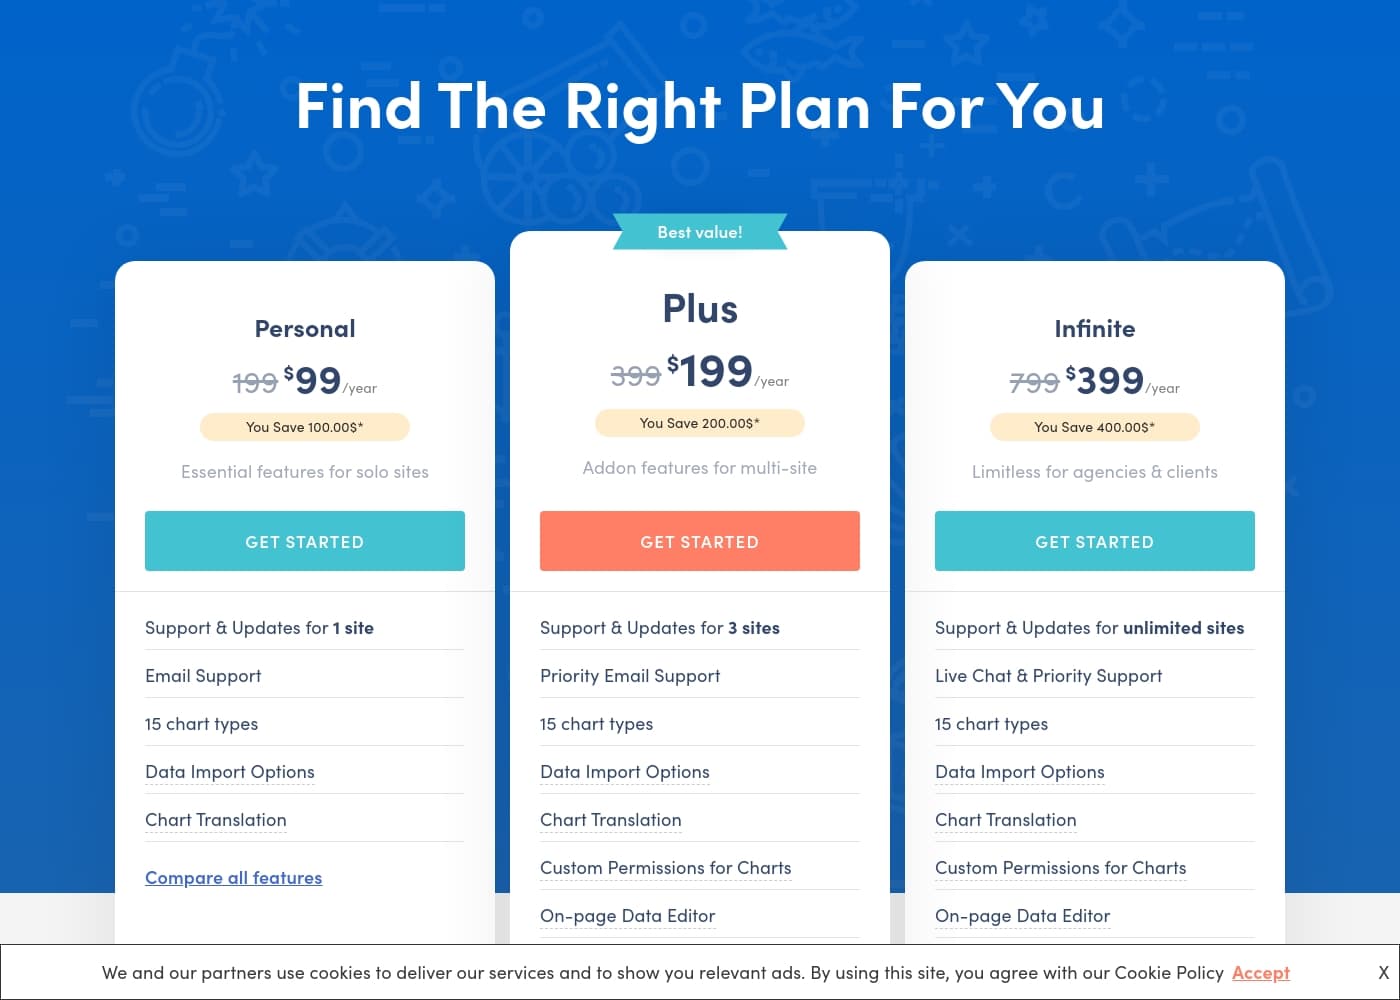
Visualizer costs between $99 and $399 per year with three plans: Personal at $99/year, Plus at $199/year, and Infinite at $399/year.

The three paid plans are clearly structured, making it easy for you to compare features and choose the right option.

Personal

Price: $99 / year Websites Supported: 1 site Best For: Essential features for solo sites Refund Policy: 30-day money-back guarantee Other Features:

  • Email Support
  • 15 chart types
  • Data Import Options (CSV, API, WooCommerce)
  • Chart Translation (WPML Support)

This plan is ideal for individual users or bloggers running just one website who require essential data visualization tools and responsive customer support.

Plus

Price: $199 / year Websites Supported: 3 sites Best For: Addon features for multi-site Refund Policy: 30-day money-back guarantee Other Features:

  • Priority Email Support
  • Custom Permissions for Charts
  • On-page Data Editor
  • Periodic Data Synchronization (all types)
  • Import data from any external database

The Plus plan is marked as the best value and is great for people managing a small portfolio of sites. It unlocks powerful collaboration tools and automatic data syncing, saving you lots of manual effort.

Infinite

Price: $399 / year Websites Supported: Unlimited sites Best For: Limitless for agencies & clients Refund Policy: 30-day money-back guarantee Other Features:

  • Live Chat & Priority Support
  • Custom Permissions for Charts
  • On-page Data Editor
  • Periodic Data Synchronization (all types)
  • Data Filter for front-end visitors

If you are an agency or developer working on many client projects, the Infinite plan gives you the flexibility you need. You get unlimited licenses and the highest level of support with live chat access.

There is no explicit free trial for the paid tiers, although a free version is mentioned in user testimonials. However, Visualizer offers a 100% money-back guarantee for 30 days. You can purchase any plan with peace of mind knowing you can cancel easily if it doesn't meet your needs.

User Reviews

User feedback, primarily directed toward the parent company Themeisle, overwhelmingly highlights exceptional customer support and outstanding responsiveness. Users frequently praise individual agents, noting their patience, professionalism, and ability to resolve complex issues quickly.

This high level of service ensures that customers, even web design novices, feel motivated and confident in using the products. The company also reliably honors its 30-day money-back guarantee, providing quick, hassle-free refunds when needed.

However, there are a handful of isolated reports regarding licensing structure, with a few users expressing confusion or feeling cautioned about site limits and renewal costs. Overall, the high Trustpilot rating (4.8 stars) suggests customers trust the reliability and dedication of the support team, which is a strong indicator for Visualizer Pro users.

👍

What users say elsewhere

Pablo M.
· Trustpilot
5.0 / 5

I made a frustrating mistake but reaching out to support immediately improved my day. Rodica showed remarkable patience, providing clear, fast, and effective solutions. I felt my motivation reignite immediately, and I’m deeply grateful for her support.

Alex K.
· Trustpilot
5.0 / 5

I had an issue with the plugin and reached out to the support team. They responded within hours and quickly offered several helpful suggestions to correct the problem. Things were working in no time, and I couldn't be happier with the fast resolution.

No reviews yet.

Write a Review

Write a Review for Visualizer
0/100 characters
0/2000 characters

Why use Visualizer?

Visualizer helps you bring more functionality to your WordPress site and saves you serious time. Stop stressing over manual data entry. Instead, choose a system that keeps your information fresh and highly functional. It offers dozens of customization options so you fully control how your data appears on any screen.

Here is why integrating Visualizer into your site workflow is smart:

  • Dynamic Data Sources: You aren't limited to basic data uploads. The plugin supports importing data from database queries, external APIs, remote URLs, and even information about your WordPress installation, like the number of posts.
  • Automatic Synchronization: Setting up periodic data synchronization means your charts update themselves seamlessly. You can schedule them to refresh every hour or day from sources like Google Sheets or external databases. This makes long-term maintenance incredibly simple.
  • Interactive Control: The charts are highly interactive, offering a dynamic experience for your visitors. You can also add advanced control features to your HTML tables, including pagination, instant search, and filtering options.
  • Easy On-Page Editing: You can use the on-page data editor to modify your chart data directly while viewing the post. This saves valuable time because you see the result immediately without switching back to the backend.
  • Strong Permission System: For team environments or sensitive data, you choose exactly who can view or edit the charts using the extensive custom permissions system. This is crucial when collaboration or security is needed.
  • Global Readiness: For sites addressing a global audience, Visualizer is ready. It supports chart translation using the WPML plugin to ensure your important data communicates clearly across language barriers.

If you manage a data-heavy site or rely on consistent external data flows, Visualizer offers robust solutions. It’s highly rated and backed by dedicated support staff. Start with the live demo to see how powerful this visualization tool truly is. ✨

Ready to transform your workflow with Visualizer?

Visualizer Alternatives

Other tools in the WordPress Table Plugin category

Frequently Asked Questions

Is there a free trial for the paid Visualizer Pro plans?

Unfortunately, an explicit free trial for the Pro tiers is not offered. However, all paid plans are covered by a 30-day money-back guarantee. You can also use the existing free version to test basic functionalities.

What is the refund policy if the plugin doesn't meet my needs?

Visualizer provides a 100% money-back guarantee. You have 30 days from your initial purchase date to request a refund. This process is guaranteed to be hassle-free.

Will the plan price increase after the first year of subscription?

Yes, it will. The prices listed are special introductory rates for the first purchase. All annual renewals will be billed at the full, higher price shown.

How are the website license limits calculated, and do subdomains count?

The license limit restricts the number of active sites receiving updates and official support. Yes, subdomains count as an active website. This rule also applies to WordPress multisite installations.

What happens to my charts and data if I upgrade from the free version to Pro?

You will not lose any existing work or data. When you upgrade, the new Pro features integrate seamlessly with your current setup. Your prior charts and configurations will be preserved.

Can I use the Infinite plan to install Visualizer Pro on client websites?

Yes, the Infinite plan allows unlimited site installations and is intended for agency use. You can install it on customer sites unless you are acting as their hosting provider.

What external systems can Visualizer import data from?

You can import data from various sources, including CSV URLs, external APIs, and WooCommerce endpoints. With the Plus and Infinite plans, you can also import data from any external database.

What level of synchronization control is available?

All paid plans allow periodic data synchronization from all supported import types. You can schedule charts to refresh automatically, doing this every hour or every day.

What is the support response time for the entry-level Personal plan?

The Personal plan includes standard Email Support. Visualizer commits to replying to these inquiries within one business day. Priority support is included in the Plus plan, and Live Chat is available with the Infinite plan.

Which plans allow me to restrict who can edit or view charts?

The Custom Permissions feature is available in both the Plus and Infinite plans. This allows you to specifically control which users can view or modify specific charts.

Is Visualizer translated or ready for multi-language websites?

The plugin is globally ready using the Chart Translation feature. It supports the WPML plugin, helping you translate chart data to communicate clearly across language barriers.

Ready to try Visualizer? Check out the official site or pricing.