Visualizer vs wpDataTables
Visualizer and wpDataTables both build powerful WordPress tables and charts. wpDataTables offers outstanding chart variety and is budget-friendly. Visualizer specializes in enhanced team security and advanced data sync controls. Deciding involves weighing visual options against robust enterprise features.
Dynamic WordPress visualization with powerful sync.
We found Visualizer to be a robust tool for managing complex data within WordPress, offering crucial features like automatic synchronization and advanced external database importing. The pricing is transparently structured across three tiers, and the widespread external praise for customer support suggests a reliable partner. Overall, Visualizer is a top-tier solution for any site needing dynamic, professional data visualization capability.
Pros
- Supports dynamic data synchronization from external APIs and databases.
- Data is easily edited right on the page using an Excel-like editor.
- Robust custom permissions allow secure team collaboration.
- Charts are translation ready via WPML support for global audiences.
Cons
- No explicit free trial is provided for the paid professional tiers.
- Renewal prices are significantly higher than the introductory rate.
- Some users have reported confusion or issues regarding site licensing limits.
Flexible, powerful, and remarkably supported.
We find wpDataTables to be a robust solution that excellently bridges the gap between complex data sources and accessible WordPress presentation. Its strong data integration features and clear responsiveness are significant advantages. Overall, this is a top-tier performer supported by a highly praised customer service team.
Pros
- Outstanding, responsive, and effective technical support.
- Seamless integration with external databases (MySQL, PostgreSQL).
- Highly responsive design ensures tables look great on mobile.
- Advanced features like formula columns and conditional formatting.
Cons
- There is no direct free trial, only a limited free version.
- External database connection is not included in the entry-level Starter plan.
AboutVisualizer
Visualizer is a powerful WordPress manager for tables and charts, trusted by over 40,000 happy users. It gives you 15 chart types to present data in a highly engaging way. The charts are innovative and specifically built for the modern web. Whether you need a simple Pie Chart, a detailed Line Chart, or an interactive DataTables table, Visualizer makes the data attractive and easy to understand. It’s built for anyone who needs to clearly communicate complex information on their website. ✅
AboutwpDataTables
wpDataTables is your reliable solution for building highly responsive data tables right inside WordPress. It is designed to make the entire process—from initial table creation to user interaction—quick, effective, and simple. This plugin greatly simplifies professional data visualization for all types of users. Whether you work in business, manage educational resources, or handle personal data projects, wpDataTables helps you organize and present your information beautifully. 💡
Highlights
Feature Comparison
Features Overview
We highlight the main differences and pick a winner for each feature.
Chart Variety & Engines
wpDataTables offers vastly more chart types across 5 visualization engines.
Visualizer provides 15 specific chart types leveraging Google Charts and Charts.js. These 15 chart types are fully responsive and highly customizable within Visualizer. Visualizer focuses on standard, robust charts, ensuring reliability and cross-browser compatibility. wpDataTables boasts 80 chart types spread across five different integrated engines. This massive variety in wpDataTables gives users unparalleled flexibility in data presentation. If you need hyper-specific or niche visualizations, wpDataTables is your powerhouse tool. The sheer quantity of options means wpDataTables is perfect for designers and power users. This is the biggest visual difference: wpDataTables offers five times the chart options. Visualizer sticks to reliable core charts; wpDataTables delivers maximum visualization flexibility. If your data presentation requires unusual chart formats, wpDataTables will meet your requirements better.
Live Content Editing
Visualizer allows on-page editing right within the live post, saving time.
Visualizer features an intuitive, Excel-like On-page Data Editor. This distinct feature in Visualizer allows authenticated users to adjust data directly on the published post. You see results instantly without ever leaving your live webpage in Visualizer. wpDataTables primarily focuses on importing data and building tables via the WordPress dashboard interface. The data changes usually need to originate from the connected external source or backend editing in wpDataTables. Therefore, quick fixes might require more clicks in wpDataTables than in Visualizer. The ability to edit charts on the fly is a massive workflow advantage Visualizer offers teams. wpDataTables relies heavily on backend configuration or external source updates for changes. This makes Visualizer ideal for rapid content revisions and testing data points immediately.
Security & Permissions
Visualizer includes robust security controls essential for team collaboration.
When handling sensitive team data, Visualizer provides Custom Permissions for Charts. This crucial feature lets you restrict viewing or editing capabilities to specific user roles or individuals in Visualizer. This is vital for maintaining security and data integrity in larger organizations using Visualizer. wpDataTables focuses on the code-free setup and data presentation features. There is no explicit mention of granular user permissions to restrict who can edit or view charts in wpDataTables. For most publishers, this is fine, but teams need more control. Visualizer is clearly superior here for team environments and secure internal reporting needs. wpDataTables is better suited for public-facing data where security constraints are lower. Use Visualizer if you need to restrict data access to managers only.
Pricing Structure
wpDataTables is significantly cheaper, but Visualizer offers a longer money-back guarantee.
Visualizer plans range from $99 to $399 annually at introductory rates. Critically, Visualizer renewals are billed at a significantly higher, full price after the first year. Visualizer does offer a generous 30-day money-back guarantee on all plans. wpDataTables provides a wider pricing range, starting incredibly low at $1/year (up to $60/year maximum range listed). wpDataTables offers a 15-day money-back guarantee, half the time of Visualizer. Pricing for wpDataTables is ideal for tight budgets. wpDataTables offers much better value for money upfront and long term if the basic plans suffice. Visualizer ensures a longer evaluation window with its 30-day guarantee. For budget-conscious users, wpDataTables wins easily. Be aware that Visualizer's low introductory plan cost only lasts the first 12 months, raising the long-term price significantly.
Data Synchronization
Visualizer gives granular control over synchronization intervals and source types.
Visualizer supports Periodic Data Synchronization from databases and APIs. You can precisely schedule updates on an hourly or daily basis within Visualizer settings. Visualizer also syncs data from WooCommerce and internal WordPress metrics. wpDataTables features live data connectivity with Google Sheets and various external databases. Data updates in wpDataTables automatically update when the initial source is changed. wpDataTables prioritizes auto-sync for live source connections. Visualizer gives the user more explicit control over the refresh timing schedules. wpDataTables shines in its immediate, automatic connection to live data sources. Both tools handle syncing capability well, but Visualizer has specific scheduler feature depth. If you need precise hourly updates from a remote API, Visualizer provides that structured schedule.
Front-End Visitor Controls
wpDataTables delivers a wider range of advanced search and filtering options.
Visualizer enhances tables with standard controls like pagination and instant search features. Visualizer also includes a 'Data Filter' for visitors to exclude data from graph displays. Visualizer's focus is on adding interactivity to the charts and tables. wpDataTables offers advanced filters including text, date, dropdowns, and checkboxes for table searches. wpDataTables also uses features like fixed headers for easier table browsing. This makes highly dynamic product catalogs perform better in wpDataTables. While both offer interactive tables, wpDataTables has superior filtering mechanics tailored for large data exploration. Visualizer’s core strength lies in securing and synching the data. wpDataTables helps users browse large directories quickly using these fine-tuned filter types.
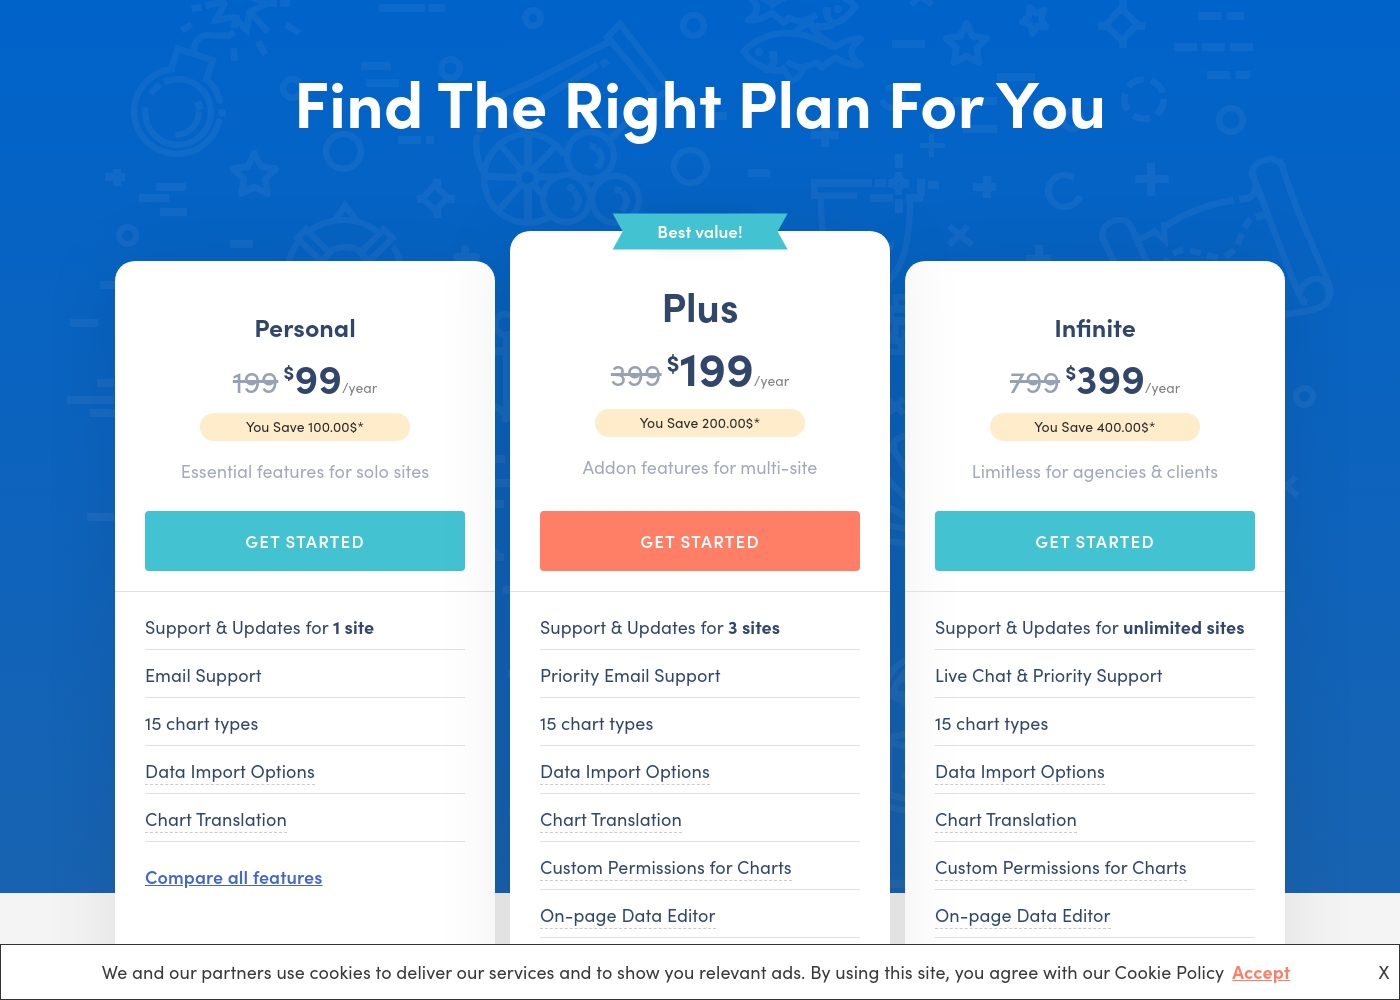
Visualizer costs between $99 and $399 per year with three plans: Personal at $99/year, Plus at $199/year, and Infinite at $399/year.
The three paid plans are clearly structured, making it easy for you to compare features and choose the right option.
Personal
Price: $99 / year Websites Supported: 1 site Best For: Essential features for solo sites Refund Policy: 30-day money-back guarantee Other Features:
- Email Support
- 15 chart types
- Data Import Options (CSV, API, WooCommerce)
- Chart Translation (WPML Support)
- Support & Updates for 1 site
- Email Support
- 15 chart types
- Data Import Options (CSV, API, WooCommerce endpoints)
- Chart Translation (WPML support)
- Support & Updates for 3 sites
- Priority Email Support
- 15 chart types
- Import data from any external database
- Chart Translation
- Support & Updates for unlimited sites
- Live Chat & Priority Support
- 15 chart types
- Import data from any external database
- Chart Translation
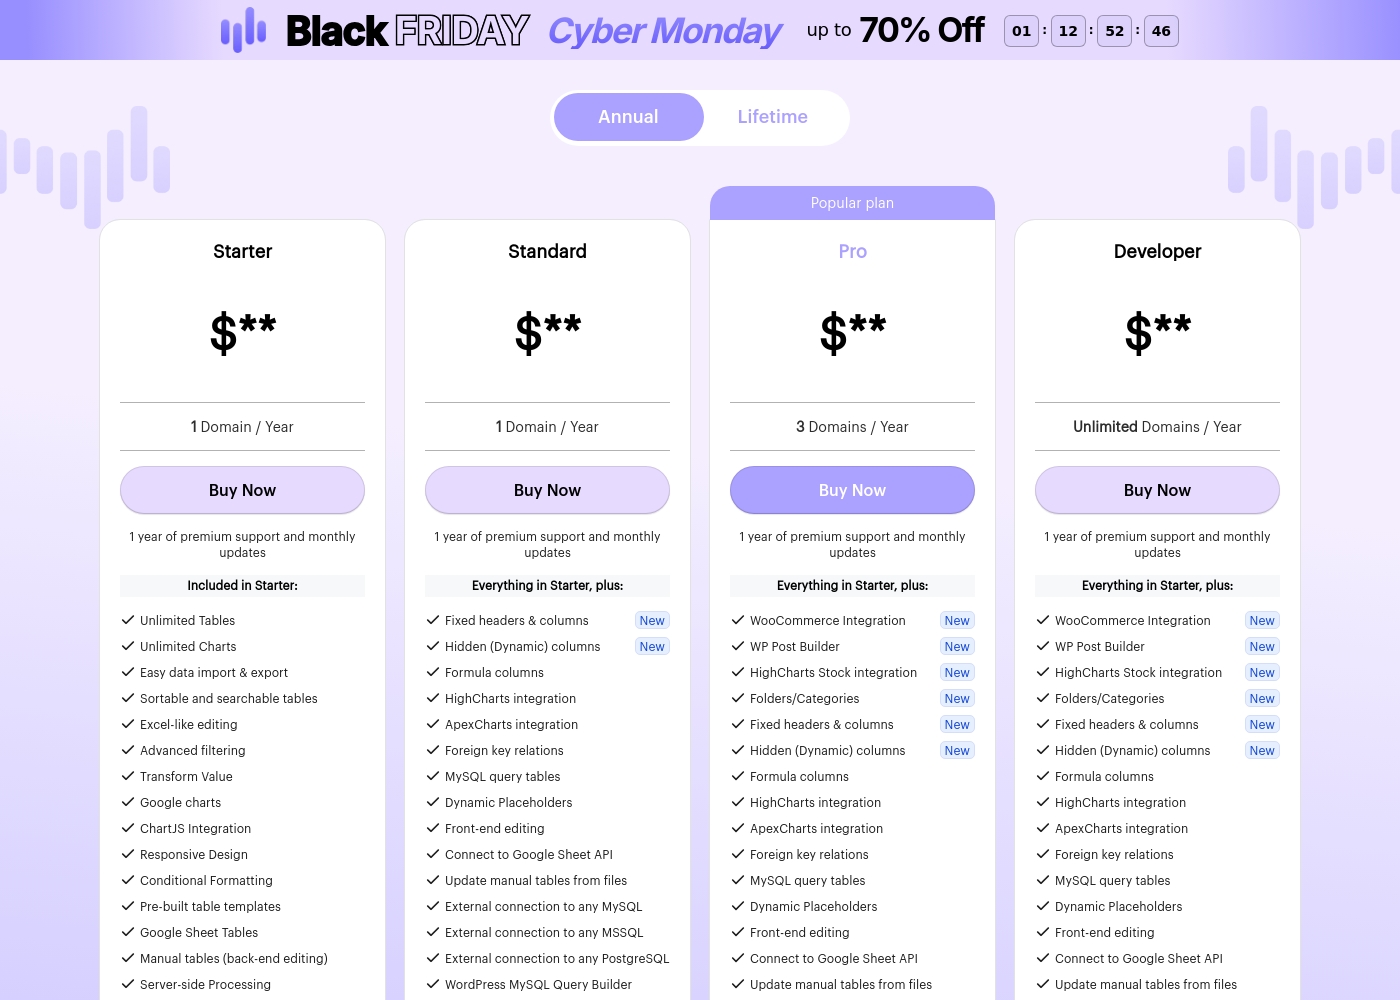
wpDataTables costs between Not explicitly stated and Not explicitly stated per year with 4 annual plans: Starter at $, Standard at $, Pro at $, and Developer at $.
Let’s explore what features are included with each plan.
Starter
Price: $** / Year Websites Supported: 1 Domain Best For: Basic table creation and data visualization. Refund Policy: 15-day money-back guarantee Other Features: Unlimited Tables, Unlimited Charts, Excel-like editing, Advanced filtering, Conditional Formatting, Server-side Processing.
- Unlimited Tables and Charts
- Easy data import & export
- Excel-like editing
- Advanced filtering
- Conditional Formatting
- Everything in Starter
- Fixed headers & columns
- Formula columns
- Front-end editing
- External connection (MySQL, MSSQL, PostgreSQL)
- Everything in Starter
- WooCommerce Integration (New)
- WP Post Builder (New)
- HighCharts Stock integration (New)
- Folders/Categories (New)
- Everything in Starter
- Unlimited Domains support
- WooCommerce Integration (New)
- WP Post Builder (New)
- HighCharts Stock integration (New)
Pricing Notes
- Visualizer offers a 30-day money-back guarantee instead of an explicit free trial.
- Visualizer's renewal prices are significantly higher than the quoted introductory rates.
- wpDataTables has a shorter 15-day money-back guarantee but a limited free version is available.
- Overall, wpDataTables appears significantly cheaper, starting at just $1/year in its low range.
Pricing Head-to-Head
User Reviews
User feedback, primarily directed toward the parent company Themeisle, overwhelmingly highlights exceptional customer support and outstanding responsiveness. Users frequently praise individual agents, noting their patience, professionalism, and ability to resolve complex issues quickly.
This high level of service ensures that customers, even web design novices, feel motivated and confident in using the products. The company also reliably honors its 30-day money-back guarantee, providing quick, hassle-free refunds when needed.
I made a frustrating mistake but reaching out to support immediately improved my day. Rodica showed remarkable patience, providing clear, fast, and effective solutions. I felt my motivation reignite immediately, and I’m deeply grateful for her support.
wpDataTables receives strong praise on Trustpilot, particularly for its comprehensive functionality and outstanding customer service. Users consistently describe the plugin as feature-rich and powerful, allowing them to create dynamic, complex tables and visualizations with relative ease.
Many reviewers noted that they could manage or generate data tables quickly, often in minutes, describing the software as one of the best WordPress plugins available. The most recurring theme is the quality of the technical support; users call the team "fantastic," "tireless," and "next to none," highlighting their responsiveness and willingness to solve complex problems.
This plugin is truly feature rich and works like a dream. I have been using it consistently for nearly five years now, which shows how reliable and excellent it is. The support team is absolutely fantastic to work with.
Our Verdict
Choosing between Visualizer and wpDataTables comes down to budget versus collaboration features. If you prioritize maximum visual flexibility and low cost, wpDataTables is your best fit. Visualizer, while costlier long-term, provides professional security and a fantastic editorial workflow. Visualizer’s superpower is making team collaboration secure and efficient. It allows specific users to restrict chart viewing and editing with custom permissions. The Excel-like On-page Data Editor lets authorized staff update data instantly on the live post. Visualizer is perfect for secure internal reporting and agency work with high expectations. wpDataTables’ superpower is its sheer variety of presentation options and incredible affordability. You get 80 chart types across five engines, ensuring you can visualize any data type. The robust front-end filtering in wpDataTables handles large directories and comparison tables seamlessly. wpDataTables is great for individual publishers or sites focused on public data. The deciding factor is the pricing and renewal structure. wpDataTables maintains cheap entry points, offering superb value right away. Visualizer offers a more feature-rich platform for teams, but remember its renewal costs are significantly higher later. Pick Visualizer if security and workflow optimization save you more time than the extra cost. For solo users and budget-conscious developers, choose wpDataTables for unrivaled chart options. If you are an agency or a secured data team, Visualizer’s superior permission controls and workflow features make it the smarter long-term investment.
Frequently Asked Questions
Which tool offers more chart options, Visualizer or wpDataTables?
wpDataTables is the clear winner for variety, offering 80 chart types across five engines. Visualizer provides 15 highly customizable, standard chart types. If chart variety is paramount, choose wpDataTables. Visualizer focuses on the quality of its 15 core types rather than quantity.
Can I edit data on the live page using Visualizer or wpDataTables?
Visualizer allows for true on-page data editing using an intuitive Excel-like interface. This is a key workflow advantage for Visualizer users. wpDataTables requires editing in the backend or updating the external data source instead.
Is wpDataTables a better value than Visualizer?
Yes, wpDataTables generally offers better value due to significantly lower entry prices. Visualizer has a higher starting price and high renewal costs after the first year. wpDataTables is better suited for users on tighter budgets.
Does Visualizer include security features for restricting access?
Yes, Visualizer includes robust Custom Permissions for Charts in its Plus and Infinite plans. This allows site administrators to restrict who can view or modify sensitive charts. wpDataTables does not prominently feature these granular security controls.
Which software has better customer support: Visualizer or wpDataTables?
Visualizer receives overwhelmingly positive feedback for its responsiveness and professional support team. Visualizer offers Live Chat support on its highest infinite tier. Both offer premium support, but Visualizer's reputation is demonstrably stronger.
Do I need a free trial for Visualizer or wpDataTables?
Neither offers an explicit free trial for paid tiers, but both have money-back guarantees. Visualizer provides a full 30-day money-back guarantee. wpDataTables provides a shorter 15-day guarantee and also a free limited version on WordPress.org.
Ready to Choose?
Both tools have their strengths. Choose based on your specific needs.