Ninja Tables vs Visualizer
Ninja Tables and Visualizer are top-tier WordPress data plugins, but their strengths differ greatly. Ninja Tables dominates in raw table performance and deep e-commerce integration. Visualizer focuses on dynamic charts, external data syncing, and team collaboration features. Your choice depends on needing lightning-fast tables or interactive reports.
Powerful tables, painless synchronization, great value.
We found Ninja Tables to be a highly competitive WordPress table builder, offering significant performance benefits, especially regarding loading speed and big data handling. Overall, we recommend it highly for users needing flexible licensing and efficient methods for live data synchronization.
Pros
- Extremely fast loading speed, even when managing big data.
- No coding required; uses an intuitive drag-and-drop table editor.
- Seamless data synchronization direct from Google Sheets.
- Dedicated features for deep WooCommerce product integration.
Cons
- Priority support and essential integrations are limited to Pro tiers.
- Introductory prices are significantly discounted off the renewal cost.
Dynamic WordPress visualization with powerful sync.
We found Visualizer to be a robust tool for managing complex data within WordPress, offering crucial features like automatic synchronization and advanced external database importing. The pricing is transparently structured across three tiers, and the widespread external praise for customer support suggests a reliable partner. Overall, Visualizer is a top-tier solution for any site needing dynamic, professional data visualization capability.
Pros
- Supports dynamic data synchronization from external APIs and databases.
- Data is easily edited right on the page using an Excel-like editor.
- Robust custom permissions allow secure team collaboration.
- Charts are translation ready via WPML support for global audiences.
Cons
- No explicit free trial is provided for the paid professional tiers.
- Renewal prices are significantly higher than the introductory rate.
- Some users have reported confusion or issues regarding site licensing limits.
AboutNinja Tables
Ninja Tables is simply the best WordPress plugin for displaying your data clearly in a tabular format. It is designed to be the ultimate solution for anyone needing organized tables. 💡 The easy, intuitive interface means it’s built for everyone—whether you are a seasoned expert or a complete beginner. You can start with Simple Mode for basic drag-and-drop tables or switch to Advanced Mode for rich customization options.
This plugin helps a wide range of users achieve their goals. Small businesses and online stores use it to display unlimited product details and boost sales. Agencies rely on its smart display to manage employee or student data. Web developers and marketers use it to quickly craft comparison tables, pricing lists, or Amazon product listings.
AboutVisualizer
Visualizer is a powerful WordPress manager for tables and charts, trusted by over 40,000 happy users. It gives you 15 chart types to present data in a highly engaging way. The charts are innovative and specifically built for the modern web. Whether you need a simple Pie Chart, a detailed Line Chart, or an interactive DataTables table, Visualizer makes the data attractive and easy to understand. It’s built for anyone who needs to clearly communicate complex information on their website. ✅
Highlights
Feature Comparison
Features Overview
We highlight the main differences and pick a winner for each feature.
Data Synchronization Depth
Visualizer connects to many more complex external data sources than Ninja Tables. Ninja Tables excels using only Google Sheets for live data imports.
Ninja Tables provides seamless live data synchronization specifically from Google Sheets. This feature ensures your web tables always reflect the spreadsheet data rapidly. However, Ninja Tables focuses heavily on this single, powerful external source. Visualizer supports periodic sync from APIs, external URLs, and database queries. The system is designed to handle multiple complex data feeds using automated schedules. Visualizer gives you much greater flexibility if your data lives outside of Google Sheets. The core trade-off is breadth versus depth of focus. Visualizer offers better integration breadth for complex technical sources. Ninja Tables provides a highly optimized, simple sync for Google Sheets users. For enterprise data stored in private SQL databases, Visualizer is the clear choice. Ninja Tables works best if your primary data source is static or housed in Google Sheets.
Performance & Big Data
Ninja Tables features a specialized 'Fast Loading architecture' built for massive datasets. Visualizer does not feature this performance acceleration.
Ninja Tables is explicitly designed to handle 'Big Data' smoothly and efficiently. The Fast Loading architecture guarantees speed, even with unlimited rows and columns. Ninja Tables ensures that your website will never slow down because of excessive table size. Visualizer emphasizes dynamic data updates and interactive displays instead of sheer performance. While Visualizer is responsive, it does not market features for handling massive, unlimited data volumes. If fast performance with huge tables is your number one priority, Ninja Tables is superior. Visualizer prioritizes interactive data visualization over large-scale table rendering speed. Ninja Tables is built to maintain speed when loading heavy e-commerce product catalogs or huge comparison tables.
E-commerce Integration
Ninja Tables offers dedicated product table features for WooCommerce stores. Visualizer provides basic data endpoints but lacks specialized e-commerce functionality.
Ninja Tables includes dedicated functionality for building WooCommerce product tables. Users can instantly organize detailed product information to boost customer engagement. This deep integration makes Ninja Tables a serious sales optimization tool. Visualizer can import basic data from WooCommerce report endpoints and display it in charts. It can visualize sales data, but it doesn't help construct interactive shopping catalogs effectively. Visualizer focuses more on visualizing analytics, not storefront presentation. Ninja Tables is designed as a direct sales tool for online stores. Visualizer is better for internal reporting on e-commerce metrics. Choose Ninja Tables to create engaging storefront product displays.
On-Page Editing & Usability
Visualizer allows editing data directly on the live post using an Excel-like editor. Editing in Ninja Tables requires navigating the backend dashboard.
Visualizer features an intuitive On-page Data Editor for rapid content modification. You can adjust your chart data right on the post and see results instantly. This Excel-like editor is efficient and saves significant time on minor fixes. Ninja Tables utilizes Simple Mode and Advanced Mode, requiring users to work from the WordPress backend. While drag-and-drop is available, changes aren't instantly live on the front end during the editing process. The process is straightforward but needs a context switch. Visualizer significantly streamlines the content management workflow for editors. Ninja Tables offers robust customization but within the standard WordPress administrative flow. Visualizer speeds up fixes and refinement for publishing teams.
Collaboration and Security
Visualizer provides custom permissions to control who can view or edit charts. Ninja Tables does not offer explicit team security controls.
Visualizer offers an extensive Custom Permissions system on its higher-tier plans. You can restrict viewing and editing access based on specific user roles or individuals. This is critical for securing sensitive corporate data or project results. Ninja Tables is primarily structured as a single-site, performance-based tool for displaying data. Security and collaboration controls are not highlighted as core features. Access is generally governed by standard WordPress user permissions. If you have a team editing charts or need to protect internal data, Visualizer is the better fit. Ninja Tables works well for single developers or simpler data presentations. Visualizer’s security features scale better for agency or corporate use.
Pricing Model Flexibility
Ninja Tables offers one-time payment Lifetime licenses for long-term savings. Visualizer only offers annual recurring subscriptions.
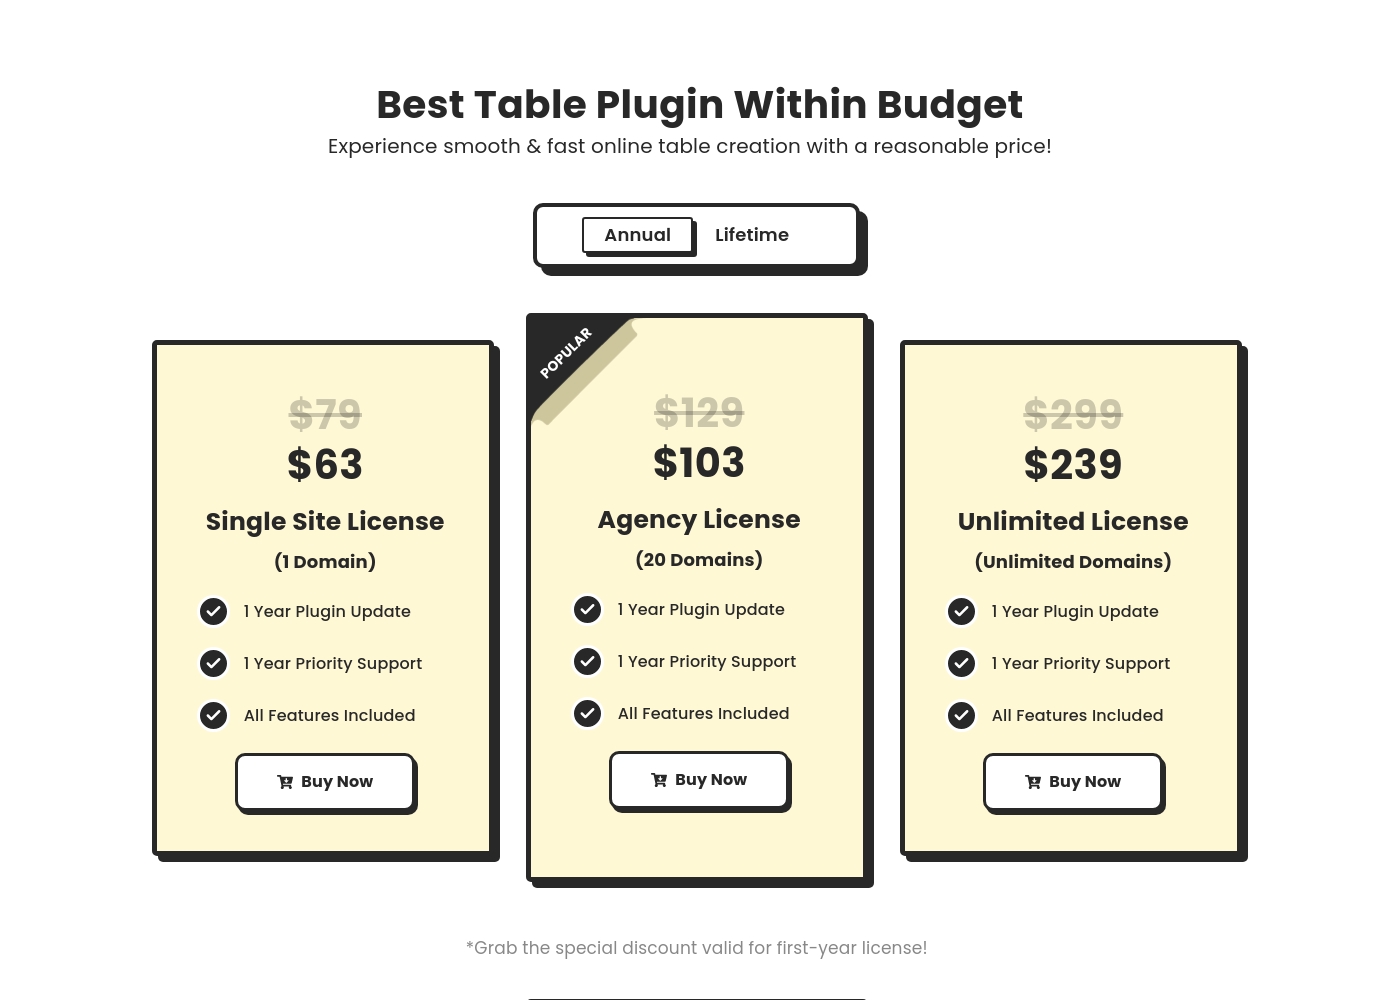
Ninja Tables provides both annual and Lifetime license options, starting at $247 for a single-site Lifetime key. This one-time purchase eliminates recurring costs for updates and support indefinitely. Ninja Tables provides great long-term value. Visualizer only sells annual recurring subscriptions, ranging from $99 to $399 per year. While plans are well-structured, users must pay yearly to maintain support and updates. The prices also increase upon renewal. For users who dislike annual subscriptions, Ninja Tables is the only viable option here. Visualizer requires a continuous yearly budget commitment. The Ninja Tables Lifetime Unlimited plan is a significant investment for large agencies.
Ninja Tables costs between $63 and $599 with six primary Pro plans: Single Site Annual at $63, Agency Annual at $103, Unlimited Annual at $239, Single Site Lifetime at $247, Agency Lifetime at $399, and Unlimited Lifetime at $599.
Let's look closely at the details of the available licenses to find the best fit for your project. Remember that the listed full prices are currently discounted for the initial purchase.
Annual Single Site License (1 Domain)
Price: $63 per year (Discounted from $79) Websites Supported: 1 domain Best For: Individual users or bloggers needing powerful tables for one website. Refund Policy: 14-day money-back Other Features:
- 1 Year Plugin Update
- 1 Year Priority Support
- Access to All Features Included
- 1 Year Plugin Update
- 1 Year Priority Support
- All Features Included
- 1 Year Plugin Update
- 1 Year Priority Support
- All Features Included
- 1 Year Plugin Update
- 1 Year Priority Support
- All Features Included
- Lifetime Plugin Update
- Lifetime Priority Support
- All Features Included
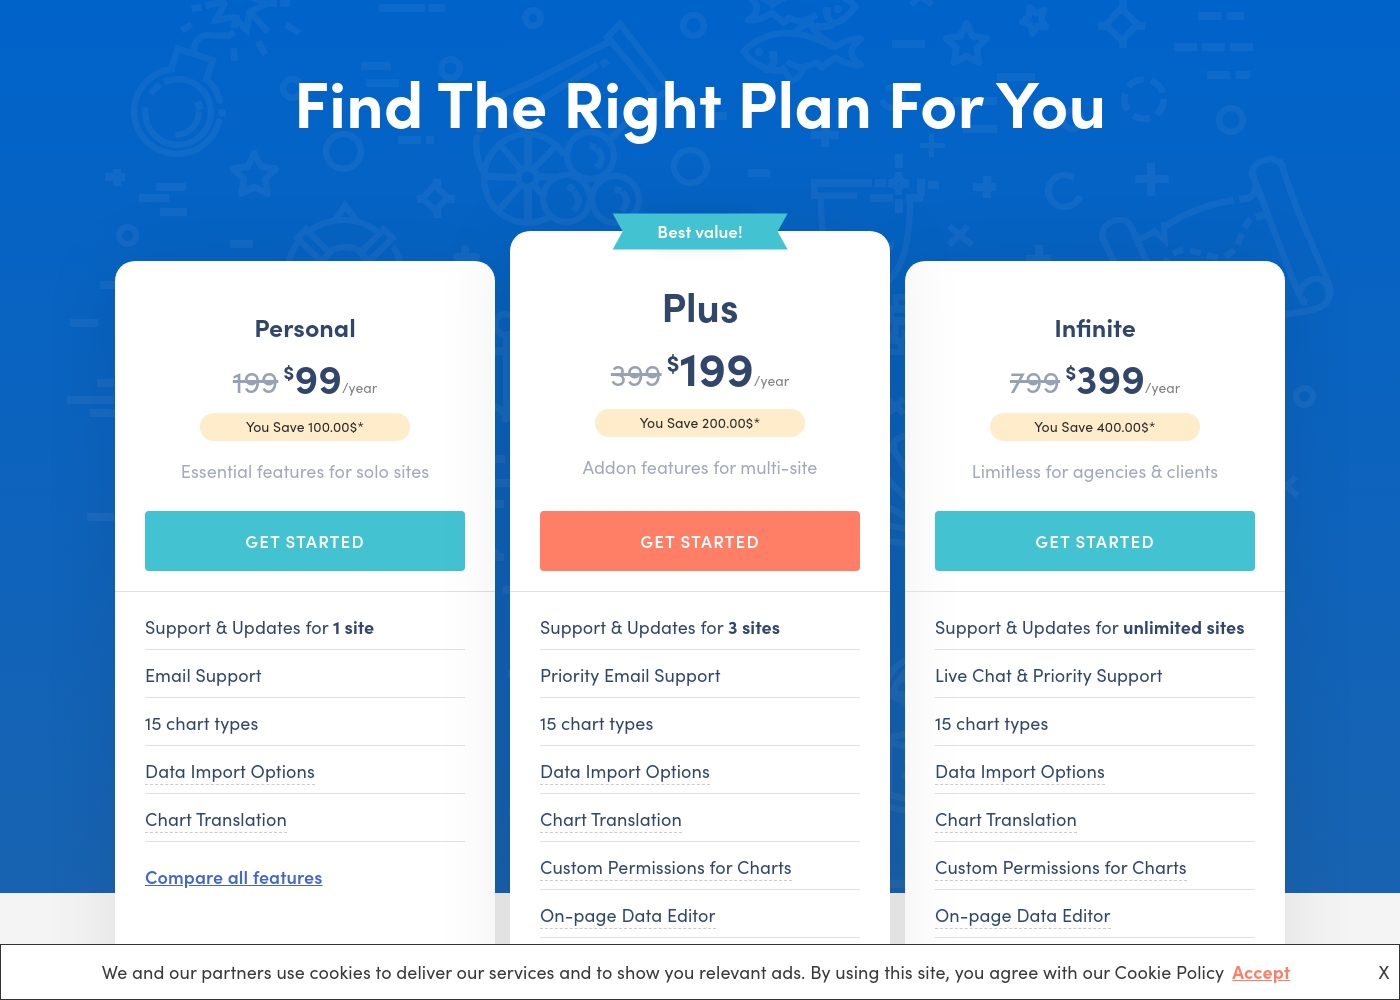
Visualizer costs between $99 and $399 per year with three plans: Personal at $99/year, Plus at $199/year, and Infinite at $399/year.
The three paid plans are clearly structured, making it easy for you to compare features and choose the right option.
Personal
Price: $99 / year Websites Supported: 1 site Best For: Essential features for solo sites Refund Policy: 30-day money-back guarantee Other Features:
- Email Support
- 15 chart types
- Data Import Options (CSV, API, WooCommerce)
- Chart Translation (WPML Support)
- Support & Updates for 1 site
- Email Support
- 15 chart types
- Data Import Options (CSV, API, WooCommerce endpoints)
- Chart Translation (WPML support)
- Support & Updates for 3 sites
- Priority Email Support
- 15 chart types
- Import data from any external database
- Chart Translation
- Support & Updates for unlimited sites
- Live Chat & Priority Support
- 15 chart types
- Import data from any external database
- Chart Translation
Pricing Notes
- Ninja Tables offers highly valuable Lifetime license options, which Visualizer does not provide.
- Visualizer offers a longer 30-day money-back guarantee, compared to Ninja Tables' 14-day guarantee.
- Ninja Tables has a lower annual entry cost at $63/year versus Visualizer's $99/year entry point.
- Both companies explicitly state that renewal prices will be significantly higher than the introductory first-year rate.
Pricing Head-to-Head
User Reviews
We were supplied with the external review platform addresses for Capterra and Trustpilot. Specifically, the Capterra page link was provided for Ninja Tables.
However, no direct user feedback snippets were supplied from either source for synthesis. Consequently, we are currently unable to report on common user themes relating to accuracy, support responsiveness, or overall value delivered in the real world.
User feedback, primarily directed toward the parent company Themeisle, overwhelmingly highlights exceptional customer support and outstanding responsiveness. Users frequently praise individual agents, noting their patience, professionalism, and ability to resolve complex issues quickly.
This high level of service ensures that customers, even web design novices, feel motivated and confident in using the products. The company also reliably honors its 30-day money-back guarantee, providing quick, hassle-free refunds when needed.
I made a frustrating mistake but reaching out to support immediately improved my day. Rodica showed remarkable patience, providing clear, fast, and effective solutions. I felt my motivation reignite immediately, and I’m deeply grateful for her support.
Our Verdict
Choosing between Ninja Tables and Visualizer is easy once you define your need. Determine if your priority is speed and complex tables, or dynamic charts and data integration. Both are excellent WordPress plugins, but they serve different core functions. Ninja Tables is the undisputed winner for performance and table mastery. It leverages a blazing-fast architecture designed to handle unlimited Big Data efficiently. If you run a massive e-commerce site, Ninja Tables’ dedicated WooCommerce features will be transformative. Plus, only Ninja Tables offers the long-term value of a Lifetime pricing model. Visualizer is the superior choice for advanced data visualization and external sync. It gives you 15 dynamic chart types and connects to complex sources like external APIs and databases. The On-page Data Editor in Visualizer streamlines content updates significantly. For teams using Visualizer, custom permissions ensure secure collaboration. The decisive factor is the output: Do you need simple, fast HTML Tables (Ninja Tables)? Or do you need dynamic, interactive Charts (Visualizer)? If your data is centralized in Google Sheets, Ninja Tables works great. If you need secure, complex external database integration, then prioritize Visualizer. Stick with Ninja Tables for pure table performance and the best long-term pricing.
Frequently Asked Questions
Which is better for e-commerce product listings: Ninja Tables or Visualizer?
Ninja Tables is better for e-commerce because it has dedicated WooCommerce product table features. It helps create detailed, engaging product storefront displays. Visualizer focuses more on displaying sales data, not product catalogs.
Does Visualizer support a Lifetime purchase like Ninja Tables?
No, Visualizer only offers annual subscriptions that renew yearly at a higher price. Ninja Tables provides flexibility with powerful one-time payment Lifetime licenses. This gives Ninja Tables much better long-term value.
Which tool offers granular user permissions for data security?
Visualizer provides advanced Custom Permissions to control editing and viewing access to charts. Ninja Tables does not include this detailed, role-based security feature. Visualizer is better for secure team collaboration.
Can I synchronize data from external databases or APIs with Ninja Tables?
Ninja Tables provides excellent live synchronization, but primarily only with Google Sheets. Visualizer offers much deeper integration for fetching data from external APIs and database queries. Visualizer connects to more complex professional sources.
Which plugin is designed to handle very large data sets or 'Big Data'?
Ninja Tables is architected for this need, boasting a 'Fast Loading architecture.' This ensures smooth performance even with unlimited rows and columns. Performance for massive tables is a core strength of Ninja Tables.
Which software has a longer money-back guarantee or refund period?
Visualizer offers a 30-day money-back guarantee for all its paid plans. Ninja Tables provides a shorter 14-day refund window. Visualizer gives you more time to test the plugin risk-free.
Ready to Choose?
Both tools have their strengths. Choose based on your specific needs.