Piktochart

Piktochart review

Turn text prompts into polished infographics, reports, and social graphics in seconds with Piktochart's AI-assisted visual editor.

By Ciroapp Editorial Team · Updated Sep 17, 2026

Commission may apply at no extra cost

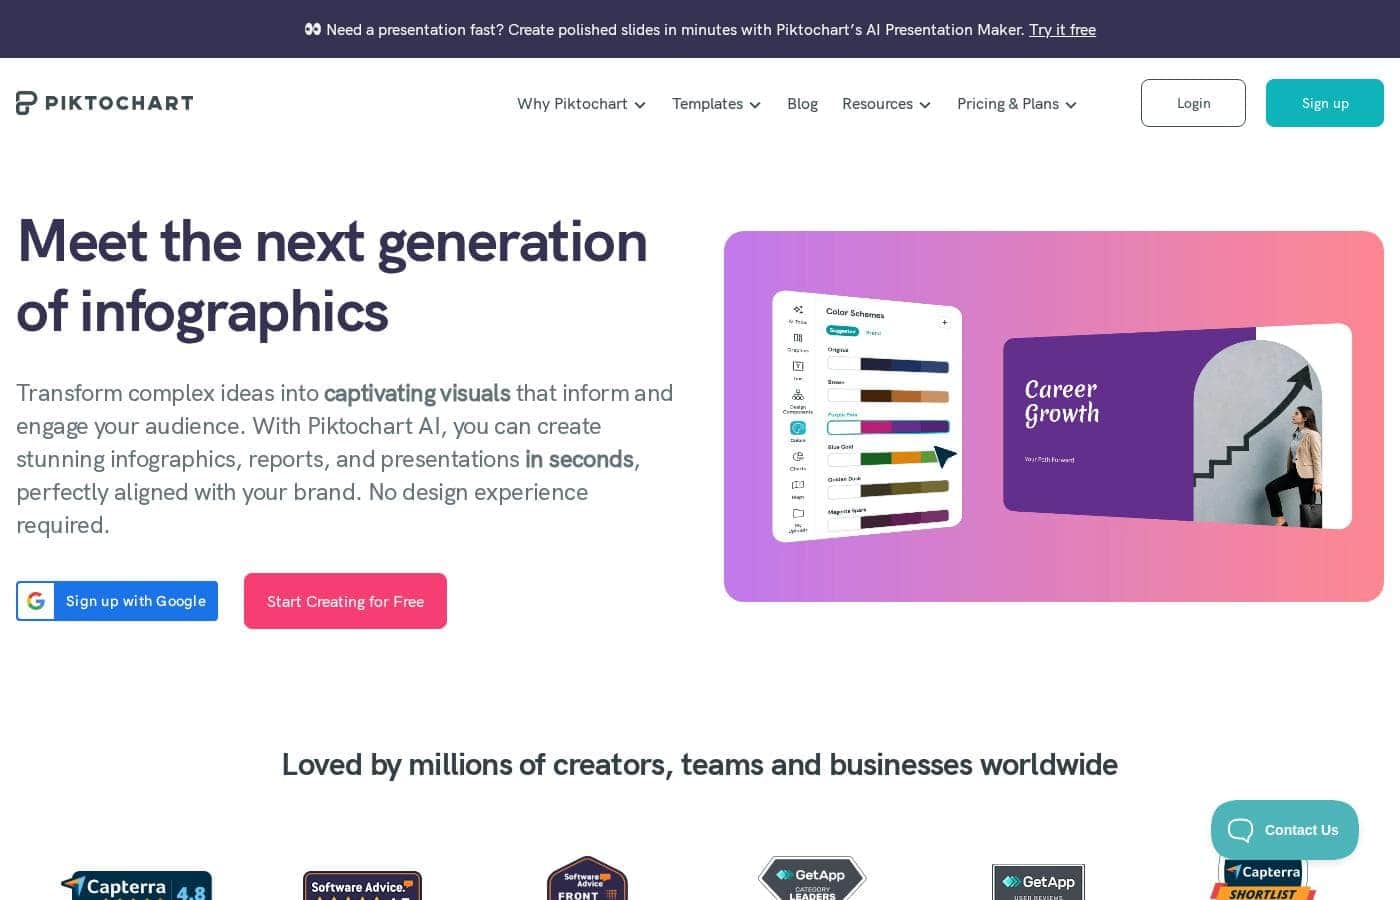
Piktochart homepage screenshot

At a glance

Quick overview for Piktochart: rating, pricing summary, key features, and highlights.
Vendor page checked Oct 13, 2026

Ciroapp score

3.7/ 5

Piktochart turns text prompts into editable infographics, reports, and social graphics in under ten seconds, backed by templates, drag-and-drop editing, and a free plan. AI output still needs a human edit, and per-seat billing can push paid costs up. Overall, it's a practical pick for non-designers who value speed over pixel-level control.

Pros

  • Pros:Pikto AI generates an editable visual draft from a text prompt in under ten seconds, which dramatically cuts time-to-first-draft
  • Pros:The free plan lets individuals and small teams use the core workflow without any financial commitment
  • Pros:Output is fully editable after generation, so AI drafts are a starting point rather than a locked image

Cons

  • Cons:AI-generated layouts still require human editing for accuracy, so it is not a fully hands-off solution for data-heavy visuals
  • Cons:Users needing pixel-level creative control or deep custom brand systems may find template-driven tools limiting compared to full design suites
  • Cons:Per-seat and usage-based billing on paid tiers means costs can scale in ways that are harder to predict for growing teams
Best for
  • Marketing teams and content marketers who need a steady stream of social graphics and infographics without a dedicated designer
  • Business professionals who produce recurring internal reports and want to turn data into readable visuals quickly
  • Educators and trainers who need to explain processes or statistics visually but lack design software skills
This section is a summary. Detailed sections about features, use cases, pricing, and reviews follow below.

What is Piktochart?

Piktochart is a browser-based visual design platform built around one core promise: making complex information easy to communicate. Its standout capability is Pikto AI, a generative engine that converts a plain text prompt into a finished visual layout in under ten seconds. That speed matters for teams that need charts, one-pagers, and social assets on a deadline but lack a dedicated designer.

Piktochart is an infographic maker and visual communication tool. You start from a text prompt, a template, or a blank canvas, then refine the result in a drag-and-drop editor. The platform covers infographics, reports, presentations, posters, and social media graphics, and it is positioned for both internal communication (reports, updates, data summaries) and external messaging (marketing visuals, social posts).
Should you choose Piktochart?

Quick buyer guidance before you compare plans or click through.

Choose it if

  • Marketing teams and content marketers who need a steady stream of social graphics and infographics without a dedicated designer
  • Business professionals who produce recurring internal reports and want to turn data into readable visuals quickly
  • Educators and trainers who need to explain processes or statistics visually but lack design software skills
  • Small teams evaluating visual tools on a budget, since the free plan covers the core workflow

Skip it if

  • Professional designers who need pixel-level control, custom vector work, or advanced typography — a full design suite is a better fit
  • Teams with strict, complex brand governance requirements that template-driven tools may not fully support
  • Users who expect AI output to be final without human review, particularly for data accuracy in charts and figures

Next steps before buying

  1. 1Create a free account on piktochart.com to access the free plan and explore the editor without a financial commitment
  2. 2Start with Pikto AI: enter a text prompt describing the visual you need and review the generated draft in under ten seconds
  3. 3Edit the AI draft — replace placeholder data with your own figures, adjust text, and apply your brand colors
  4. 4Browse the template library for your recurring formats (reports, social posts, presentations) and save a base template for consistency
  5. 5Review the pricing page to compare free, monthly, yearly, per-seat, and usage-based options before scaling to a paid tier

Piktochart Key Features

✨ Pikto AI text-to-visual generation

Pikto AI is the platform's generative engine. You describe what you want in a text prompt, and it produces a visual draft in under ten seconds. The output is a structured layout you can edit, rather than a flat image, so you can swap data, adjust colors, and rework text after generation.

This is the fastest path from a blank page to a usable first draft.

✨ Drag-and-drop infographic editor

The core editor handles the formats Piktochart is known for: infographics, reports, and one-pagers. Elements snap into place on a canvas, charts can be fed with your own data, and text blocks resize as you edit. Because it runs in the browser, there is nothing to install and work is accessible from any machine.

✨ Template library for common formats

Piktochart ships with templates spanning reports, presentations, posters, and social media graphics. Templates provide pre-set layouts, color schemes, and typography, which keeps multi-page or multi-post deliverables visually consistent. For teams producing recurring assets — monthly reports, weekly social posts — starting from a saved structure saves significant time.

✨ Data visualization tools

Since the platform's stated goal is making complex data understandable, it includes charting and data visualization components that can be populated directly inside the editor. This matters for anyone translating spreadsheets or survey results into visuals an audience can absorb at a glance.

Use Cases

💡 Internal reports and business updates

Teams that need to summarize quarterly results, project status, or survey findings can use Piktochart to turn raw numbers into a one-page visual report. The AI generation handles the initial layout, and the data visualization tools keep charts consistent across recurring reports.

💡 Marketing and social media graphics

For external messaging, Piktochart covers social media graphics, posters, and campaign visuals. Templates keep branding consistent across a series of posts, and the speed of AI generation makes it practical to produce variations for different channels or audiences.

💡 Infographics for education and content marketing

Educators, trainers, and content marketers use infographics to explain processes, comparisons, and statistics. Piktochart's template-driven approach means a non-designer can produce a publishable explainer graphic, and the editable output means facts and figures can be updated when the underlying data changes.

💡 Presentations and pitch material

The platform supports presentation formats, so users can build slide decks with the same visual language as their reports and infographics. This is useful for pitching internally or to clients when the material needs to carry data, not just bullets.

Piktochart pricing

Prices not verified yet — see the vendor page.

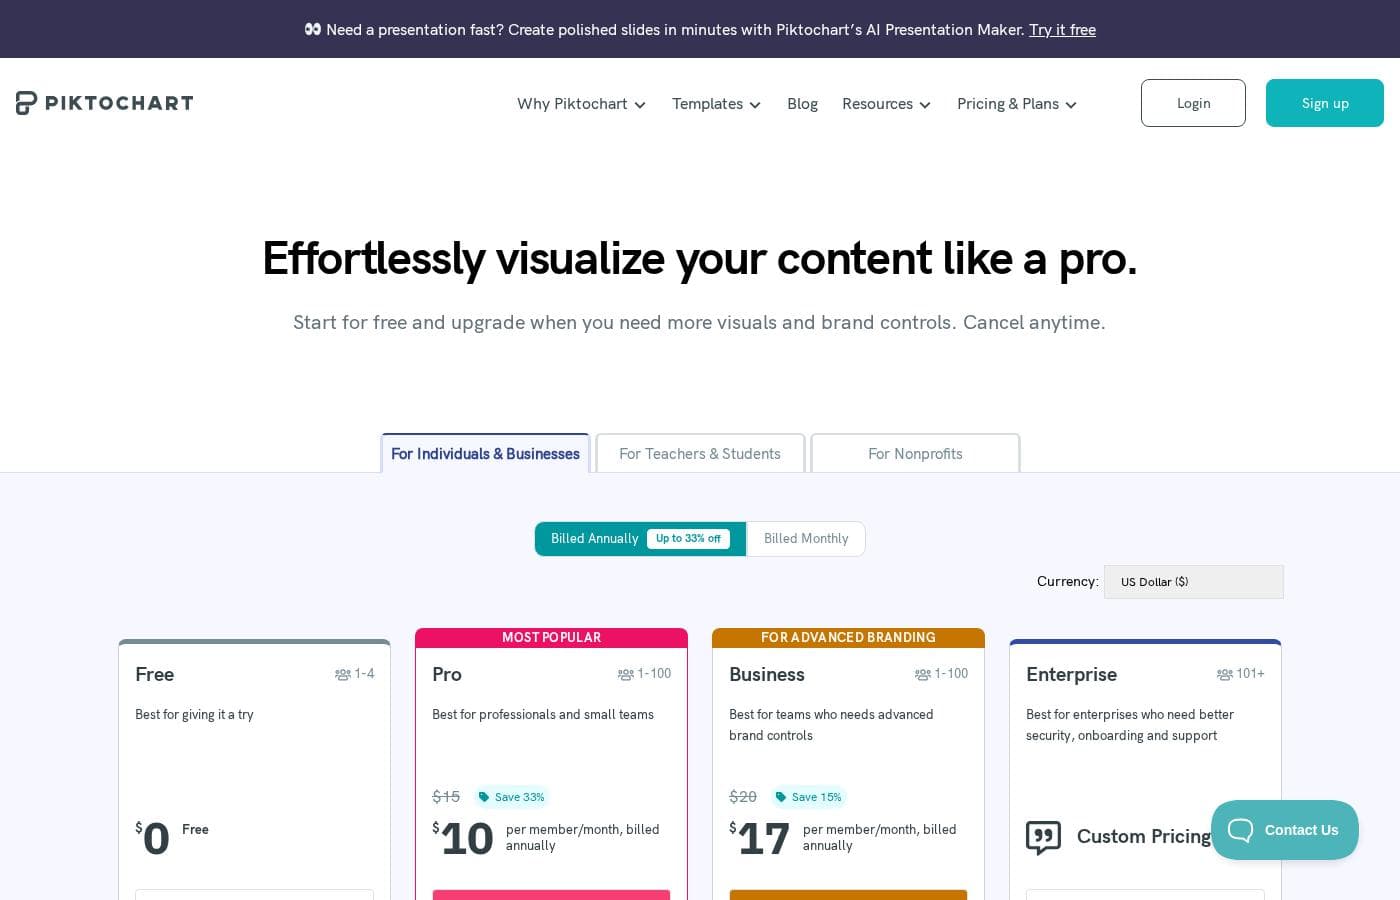
Piktochart's pricing page

Piktochart pricing page screenshotView pricing page screenshot

Price history

Tracking prices since Oct 1, 2026. No price change detected yet.

Pricing types: Free plan, Monthly subscription, Yearly subscription, Per seat pricing, Usage-based pricing

Email me when Piktochart changes price

One email when we detect a price change on the vendor's pricing page. No newsletter, no deals. Unsubscribe in one click.

User Reviews

No reviews yet.

Write a Review

Write a Review for Piktochart
0/100 characters
0/2000 characters

Why use Piktochart?

Most people who need a visual are not designers, and traditional design tools have a steep learning curve. Piktochart addresses that by generating a structured, editable first draft from a prompt, so the work shifts from layout and composition to light editing.

Because it is web-based, teams can share and iterate on visuals without passing files around, and the free plan lowers the barrier to testing whether the workflow fits.

Piktochart alternatives

Other tools in the Infographic Maker category

View all Infographic Maker tools
Infogram

Infogram

Infographic Maker4.1/5

Infogram is a widely trusted tool built for creating professional data visualizations. It provides a simple service for everyone, whether you are planning presentations or managing large organizational data projects. Infogram empowers over 30,000 companies globally by helping them captivate various audiences and simplify complex data. Users can also access a diverse range of premium visual assets, including high-quality photos and icons, right within the platform.

EdrawInfo

EdrawInfo

Infographic Maker3.8/5

EdrawInfo is a super beginners-friendly design tool. It helps anyone create eye-catching infographics quickly and effortlessly. The software is available for both Mac and Windows users. Designing a compelling visual is remarkably easy. You simply select one of the many templates, use the library symbols, add your text, customize details, and export the file. You don't need any special skills to start seeing results. 💡 It provides a vast number of vector cliparts and helps you find inspiration easily. Every element is highly customizable, letting you adjust things like colors, chart values, lines, and even shadow effects.

Piktochart FAQ

How fast can Piktochart produce a visual from a text prompt?

According to the vendor, Pikto AI transforms a simple text prompt into visual content in under ten seconds. The result is an editable draft, so you will typically spend additional minutes refining data, text, and styling before the asset is finished — but the blank-page problem is eliminated.

Does Piktochart have a free plan?

Yes. Piktochart offers a free plan, and paid plans range up to $3000/month depending on tier and team size. Billing options include monthly and yearly subscriptions, per-seat pricing, and usage-based pricing, so you can start free and upgrade as your volume of visuals grows.

Do I need design experience to use Piktochart?

The platform is explicitly designed for people without design experience. Templates and AI generation handle layout and composition decisions, and the drag-and-drop editor covers the remaining adjustments. Users with design backgrounds can still exercise control, but the workflow does not assume it.

What kinds of visuals can I create with Piktochart?

The platform covers infographics, reports, presentations, posters, and social media graphics. Because the editor and templates are shared across formats, a team can maintain a consistent visual style across all of these deliverables from a single tool.

Ready to try Piktochart? Check out the official site or pricing.

Are you Piktochart? Claim this listing · Get the badge