Unlock the Power of Data Visualization with Infogram! From interactive charts to real-time dashboards, discover how this tool can transform your data into captivating visuals. But is it the right fit for you? Dive into our in-depth review to explore its features, pricing, and even the pros and cons. Don’t miss out on making an informed decision!
Read further to learn more about Infogram, in our review we will detail its features, pros and cons with our rating, and a conclusion about why you should use it.
Click on “open” if you want to see exactly what we will talk about in the rest of this article.
Overview
What is Infogram?
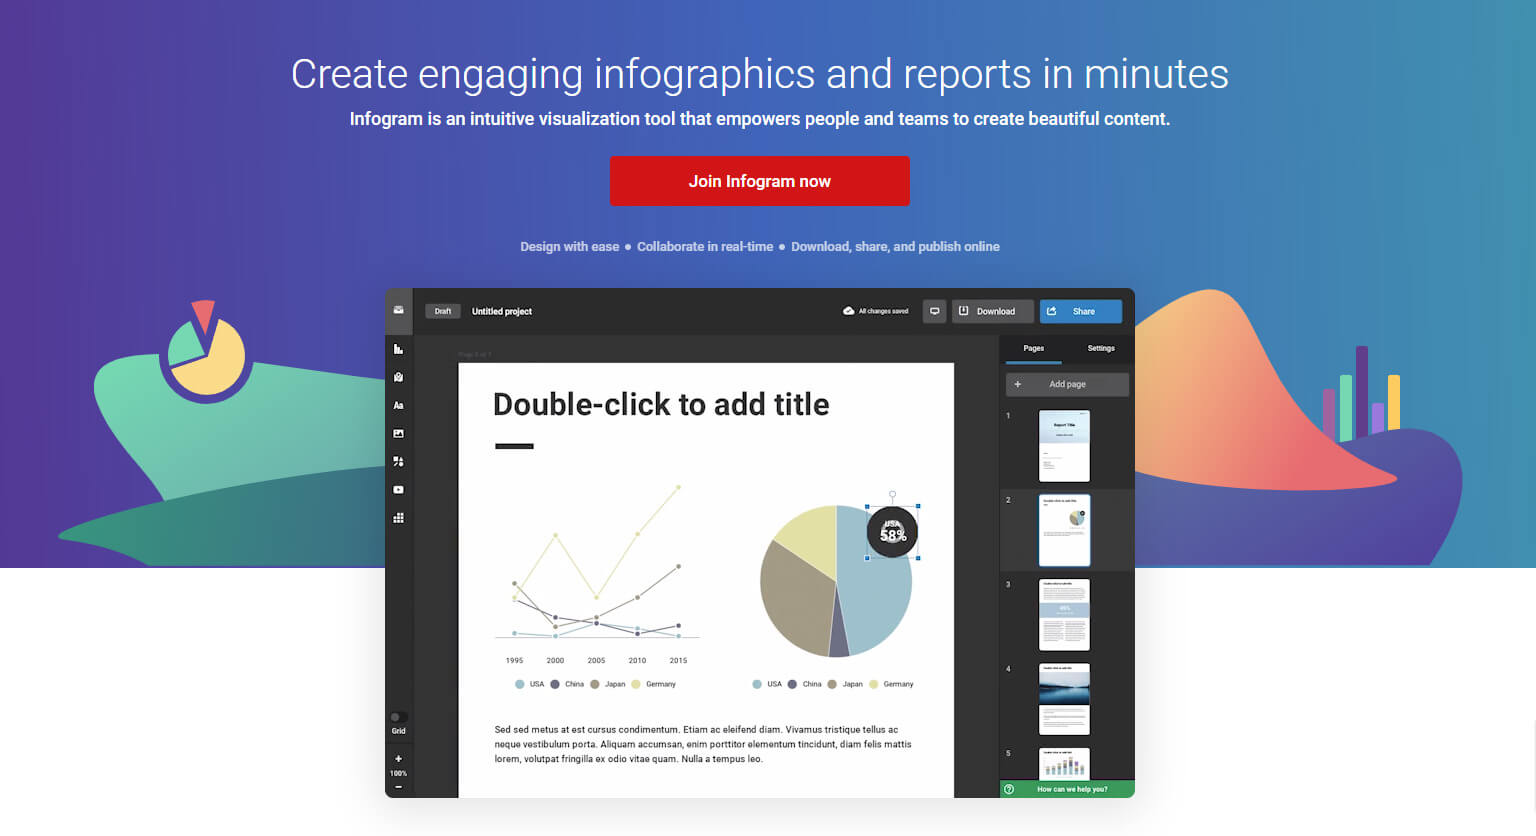
Infogram is an intuitive visualization tool designed for creating and sharing infographics, reports, slides, dashboards, and interactive maps. The software offers real-time collaboration features, allowing teams to work together seamlessly. It also provides a range of templates and customization options to help users stay on brand.
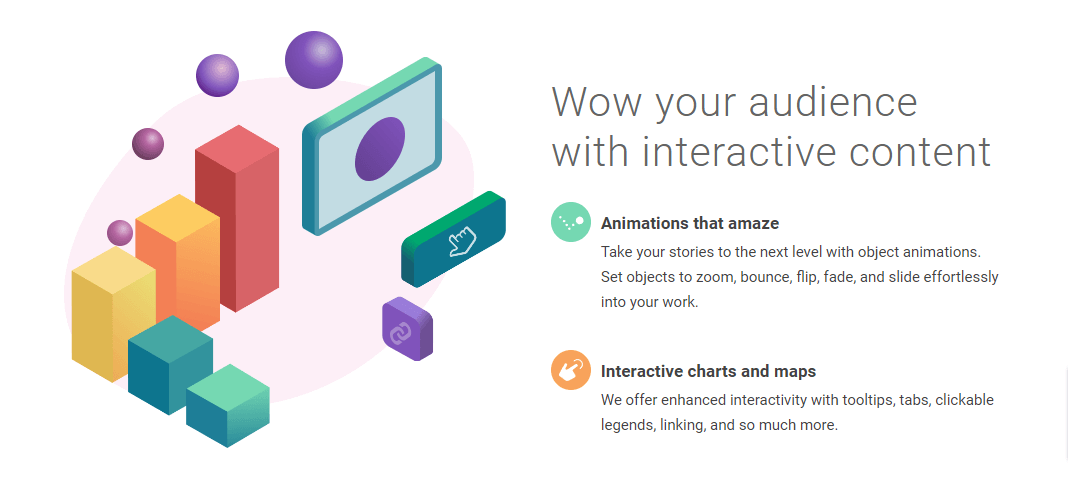
Enhanced interactivity features like tooltips, clickable legends, and object animations add a dynamic touch to the content. Infogram is optimized for both web and mobile experiences, and its analytics capabilities enable users to track viewer engagement and other key metrics.
Infogram specifications
| Features | Create Charts / Drag & Drop Editor / Easy to use Design tool / Import And Export Of Data / Over 80 pre-built reports / Real-time Collaboration / Rich Stock Media Library / Social Media Templates / Templates and Themes / WordPress publishing |
| Website URL | Visit official website |
| Support link | Support page |
| Company address | Latvia |
| Year founded | 2012 |
Pricing
Infogram pricing: How much does Infogram cost?
Infogram offers a range of pricing plans to suit various needs, starting with a free Basic plan that includes limited features like 37+ chart types and up to 10 projects.
The Pro plan, priced at $19/month when billed yearly, expands on this with additional templates and data import options.
The Business plan at $67/month offers even more customization and analytics features, while the Team plan at $149/month adds real-time collaboration and engagement analytics.
| Pricing range | From Free to $179 per month |
| Pricing types | Annual subscription / Free / Monthly subscription |
| Free plan | Yes |
| Free trial | No |
| Money back guarantee | No |
| Pricing page link | See plans |
Infogram pricing plans
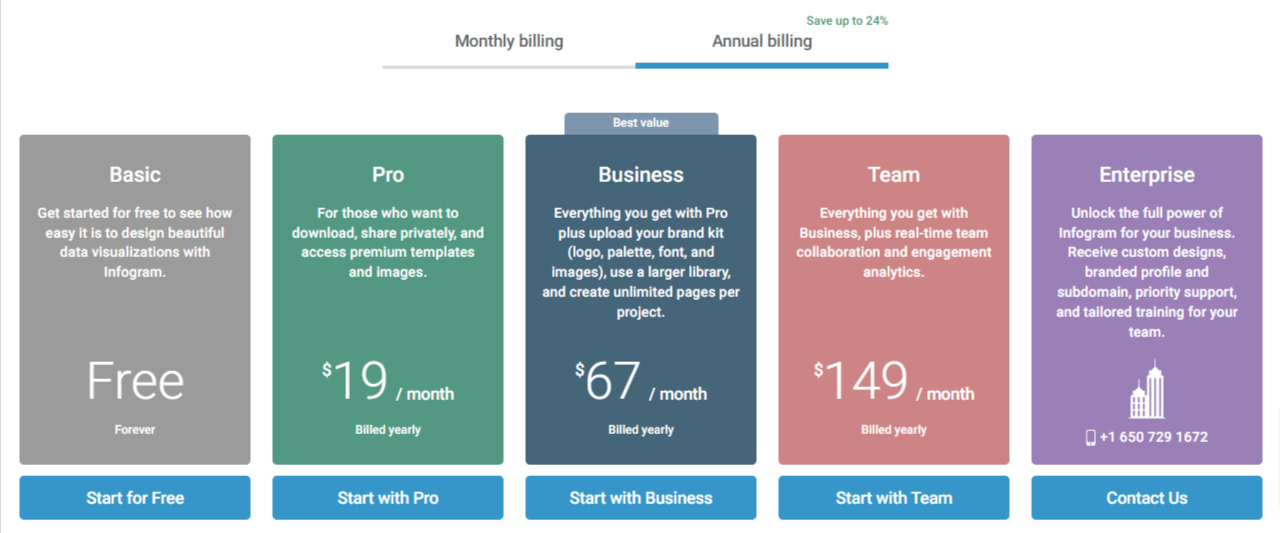
Basic Plan
Price: Free Forever:
- 37+ interactive chart types
- Up to 10 projects
- Up to 5 pages per project
- 13 map types
- Publish your content online
- Import data
- Object animations
Pro Plan
Price: $19/month (Billed yearly)
- All Basic features, plus:
- Up to 100 projects
- Up to 10 pages per project
- 100+ premium templates
- 550+ map types
- 1 million images and icons
- Advanced image editing features
- Download HD images and videos
- Privacy control
- Data connections and live data
Business Plan
Price: $67/month (Billed yearly)
- All Pro features, plus:
- Up to 1,000 projects
- Unlimited pages per project
- Your brand logo, color palette, fonts, and image assets
- Basic analytics
- SQL Connectors, Iframe integrations
- Version history
- Callouts, custom links, and page linking
- Presenter notes
Team Plan
Price: $149/month (Billed yearly)
- All Business features, plus:
- Up to 3,000 projects
- Single team functionality starting with 3 users
- Real-time collaboration
- Commenting
- Engagement analytics
- Tracking links
Enterprise Plan
Price: Custom Pricing
- All Team features, plus:
- Up to 10,000+ projects
- Branded public profile and subdomain
- Multiple team functionality starting with 10 users
- Advanced training & dedicated account manager
- First Priority support
- Custom design implementation and team templates
- Export interactive charts and maps for offline use
- Custom development
- SSO
- 99.9% uptime SLA
- Web tracking opt-out
Features
Infogram features: What can you do with it?
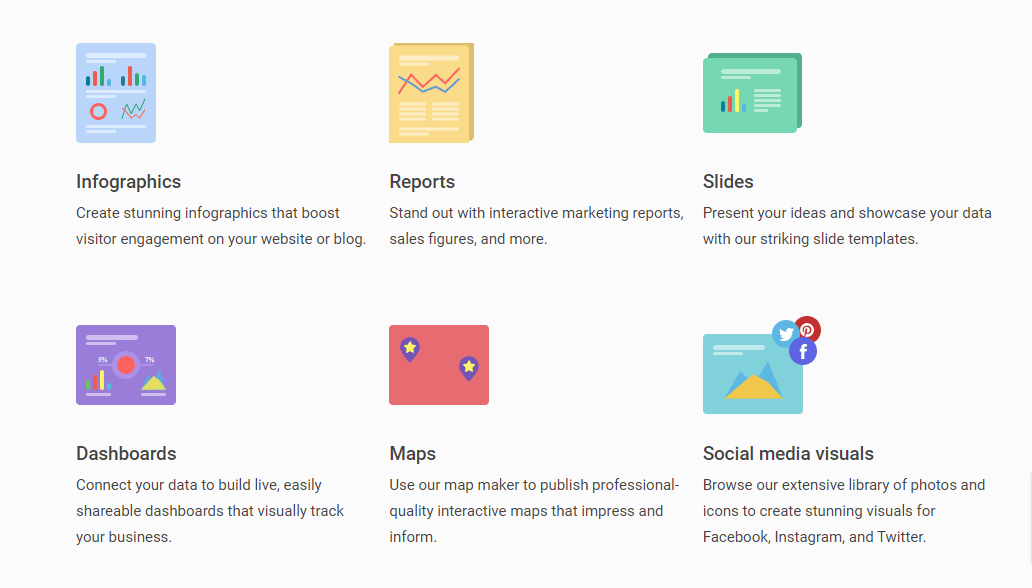
Infogram is a comprehensive data visualization tool that offers a plethora of features designed to make your data come alive. From a wide array of interactive charts and maps to an easy-to-use drag-and-drop editor, the platform provides everything you need to create stunning infographics, reports, and dashboards.
With additional functionalities like a vast library of images and icons, multiple data import options, and robust team collaboration features, Infogram ensures that both individuals and teams can produce high-quality, interactive, and visually appealing content effortlessly.
Charts, Graphs, Maps, and More
Infogram offers a wide variety of data visualization options, including more than 35 types of interactive charts and over 550 maps. Users can choose from pie charts, bar graphs, column tables, and word clouds to best represent their data.
Dazzling Designs
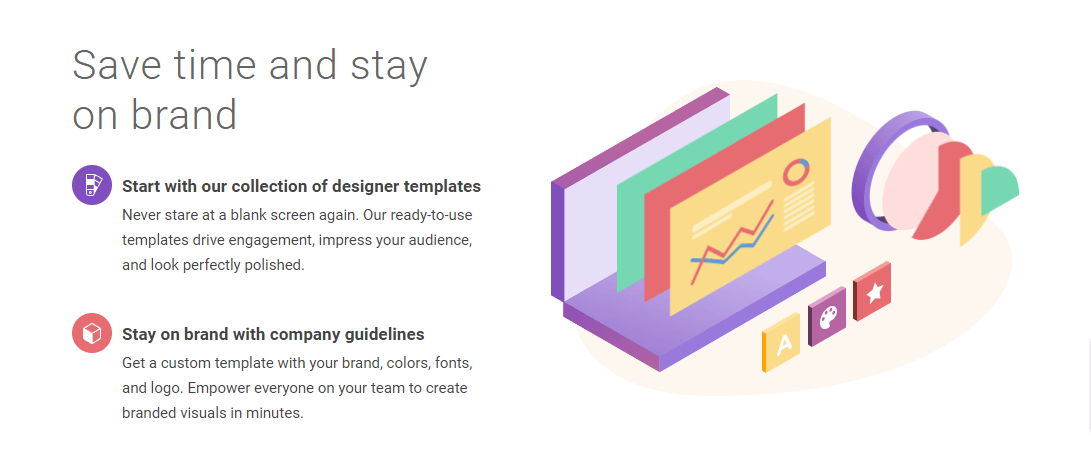
The platform provides over 20 ready-made design themes. Users can also create a customized brand theme that includes their own logo, colors, and fonts.
One Million Images and Icons
Infogram has a vast library of high-quality, royalty-free stock photos, icons, GIFs, and flags. Users can also upload their own images and icons to use in their projects.
Easy Drag-and-Drop Editor
The software features an intuitive, lightweight data editor that allows users to easily edit colors and styles, add icons, and set display options.
Import Your Data with Ease
Users can input data directly into the editor, upload a spreadsheet, or integrate live data from cloud services. An API is also available for more advanced data integration.
Download Options
Infogram allows users to export their data visualizations in various formats like PNG, PDF, or GIF. They can also embed these using an interactive HTML option.
Interactive Charts
The platform enables the creation of interactive charts and graphs that the audience can explore. Users can add links to these charts to increase engagement and drive traffic to their site.
Interactive Maps
Users can visualize data from over 550 countries and regions using interactive heat maps, geographic time-series data, and marker icons.
Interactive Reports
Infogram allows for the creation of engaging, easy-to-read reports that can be customized for specific brands and audiences. These reports can also be embedded online and tracked using analytics.
Interactive Dashboards
Users can design dashboards that are not only visually appealing but also always up-to-date due to live data connections.
Publish Your Content Online
The software ensures that all infographics are fully responsive and look great across all devices. Users can add them to Facebook Instant Articles, publish on Medium, or use the Infogram WordPress plugin.
Team Collaboration
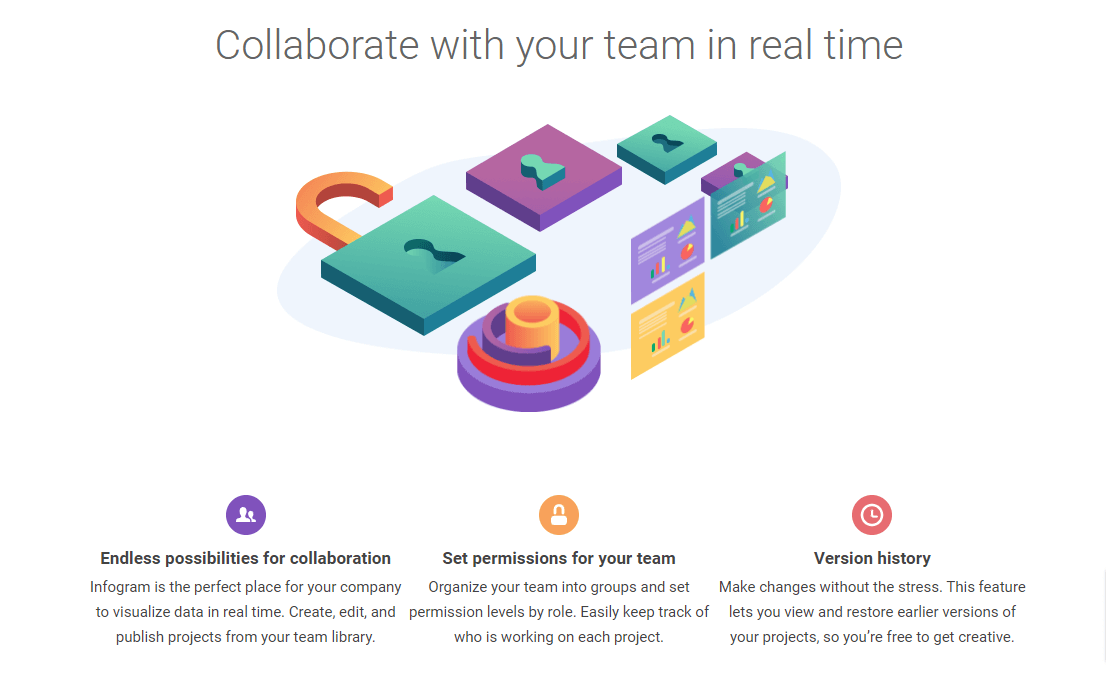
Infogram offers features for team collaboration, allowing team members to edit projects, share folders, and create together. Privacy settings and access permissions are also available to maintain control over projects.
Conclusion
Infogram review: Why you should use it?
Infogram is an ideal choice for those looking to create visually appealing and interactive infographics, reports, and dashboards without requiring technical expertise. The platform offers an intuitive interface, a wide variety of visualization options, and seamless integration with web pages and social media.
It’s particularly beneficial for non-technical users, as it makes data visualization less intimidating and allows for quick creation of professional-looking content.
However, it may not be the best fit for those seeking to create highly complex or customized designs, as it has some limitations in customization and requires an online connection. Additionally, downloading your charts for offline use is only available in the paid plans.
Pros
- Ease of Use: Infogram’s user-friendly interface makes it accessible even for those without technical expertise, allowing for quick and easy creation of visual content.
- Variety of Visualization Options: The platform offers a wide range of charts, graphs, and maps, providing users with multiple ways to represent their data.
- Real-Time Collaboration: Team members can work together on projects in real-time, enhancing productivity and ensuring consistency.
- Seamless Integration: Infogram’s content can be easily embedded into web pages and is compatible with various social media platforms, making it versatile for different uses.
- Customization: While not limitless, the software does offer a good range of customization options, including themes and templates, to help you stay on brand.
Cons
- Limited Customization: For those looking to create highly customized or complex visualizations, Infogram may not offer enough flexibility.
- Online Requirement: The platform is web-based, meaning you need a reliable internet connection to use it.
- Download Restrictions: Free users cannot download their charts for offline use; this feature is only available in paid plans.
- Learning Curve: While generally user-friendly, some users might take time to get accustomed to all the features and functionalities.
FAQ

